


Should You Increase Stock Exposure in Retirement?

Conventional wisdom suggests you should start your retirement with a “balanced” portfolio (something like 60% stocks and 40% bonds) and then decrease your stock exposure as you age.
But more recent research and the data in this post argue this is precisely the opposite of what a retiree should do if they want to minimize the risk of depleting their portfolio.
In fact, a retiree may be better served by ratcheting down risk significantly in the early stages of retirement and then increasing stock exposure over time.
Conventional Retirement Glidepaths
Reducing stock exposure in your 60s, 70s, and 80s is one of those ideas that sound good on paper and like simple common sense, but isn’t supported by data.
Unfortunately, this is the conventional wisdom and the methodology that major target-date funds follow.
The general idea is a retiree should retire with a “balanced portfolio,” generally around 50%-60% in stocks and the remainder in bonds, and then reduce stock exposure over time.
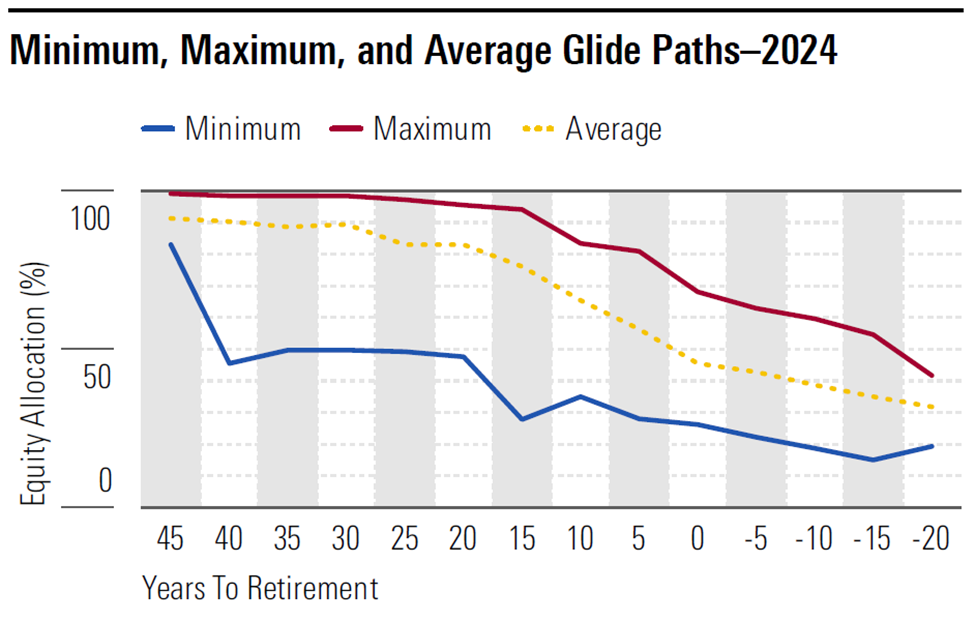
Source: Morningstar 2025 Target-Date Fund Investment Strategy
Morningstar summarized the asset allocation glidepaths of the target date fund universe in their 2025 Target-Date Fund Investment Strategy report. As you can see, the average stock allocation is very aggressive (~90% stocks) for investors with many years prior to retirement. But the stock allocation begins to decline meaningfully as an investor reaches within 20 years of their target date and averages just under 50% stocks at retirement.
The exposure to stocks continues to decline throughout retirement, with an average of approximately 40% stocks ten years beyond retirement and 30% stocks 20 years beyond retirement.
Although this is the conventional wisdom and consistent with rules of thumb like “100 minus your age in stocks,” a closer look reveals that, if your goal is to reduce your risk of running out of money in retirement, this is unlikely to be the optimal strategy.
Rising Equity Glidepath
A 2013 paper entitled “Reducing Retirement Risk with a Rising Equity Glide-Path” found that “rising equity glide-paths in retirement… have the potential to actually reduce both the probability of failure and the magnitude of failure for client portfolios.”
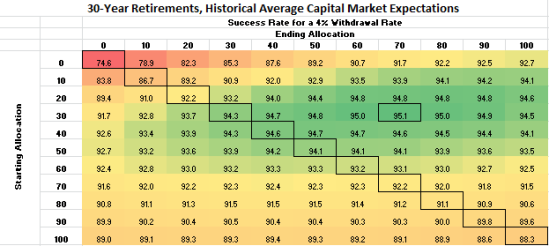
A rising equity glidepath would start with a relatively low stock exposure early in retirement and then increase exposure to stocks. The below chart summarizes the probability of success results of Monte Carlo simulations based on different starting and ending stock allocations; the starting stock allocation is on the vertical axis and the ending stock allocation is on the horizontal axis. The simulation assumes a 30-year time horizon with a starting 4% withdrawal rate.
The highest probability of success (95.1%) results from a glidepath that starts at 30% stocks and ends at 70% stocks. In general, the greatest probability of success results cluster near the glidepaths that start near 20%-40% stocks and end with 60% or more in stocks. Far different than the conventional wisdom.
The paper identifies the strength of the rising equity glidepath as reducing risk at exactly the point where retirees are most vulnerable to a major market decline. A major decline in the early stages of retirement is a major reason most plans will “fail.”
Research from 2007 had already determined that a fixed stock allocation is superior to a declining equity glidepath, and the 2013 paper extended the research to consider a rising equity glidepath.
Monte Carlo & Glidepath Comparison
We will evaluate the impact of three retirement glidepath strategies for sample retirees using a Monte Carlo analysis.
What is a Monte Carlo Analysis?
Monte Carlo analysis is a statistical tool common in retirement planning to assess the likelihood of achieving retirement goals under a broad range of potential market scenarios. Rather than relying on static projections or a single sequence of returns, it uses thousands of simulations to model how portfolios might perform given the randomness of market returns, changes in savings, withdrawal patterns, and other variables.
For each simulation, the model randomizes factors like investment returns and inflation, then calculates whether a retiree's assets will last throughout their desired retirement horizon. The output is summarized in our financial planning tool with a "Probability of Success" figure and a median ending asset value.
The probability of success is the percentage of the 1,000 simulations in which the retiree did not run out of money by the end of their planning horizon. The median ending asset value is the ending asset value for the middle-of-the-road (or 500th) simulation.
Glidepath Options
The three glidepaths we will compare are the conventional declining equity strategy, a fixed equity allocation strategy, and a rising equity strategy.
The conventional declining equity glidepath assumes the following asset allocation. The allocation is approximately 50% in stocks at retirement and steadily declines to 44% at age 70, 29% at age 80, and reaches a minimum of 20% at age 86.
Declining Equity Glidepath
The fixed equity allocation strategy is very straightforward and assumes a static 60% stock exposure throughout retirement.
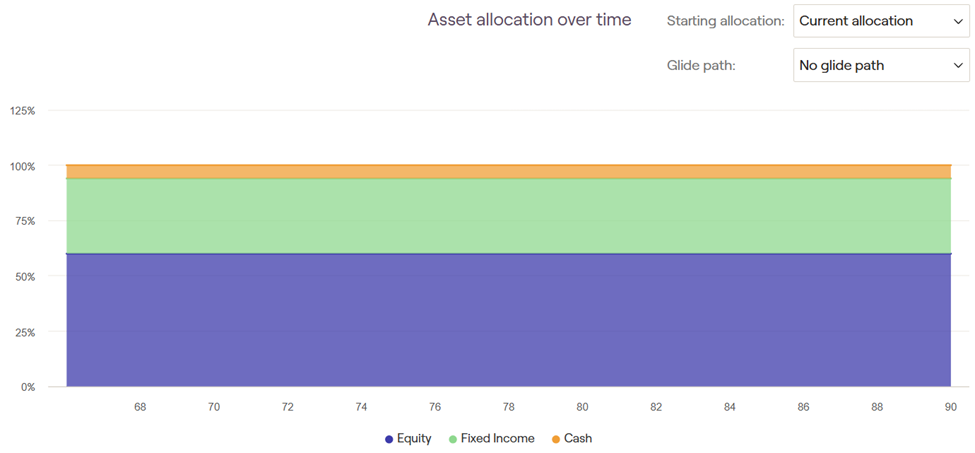
Fixed Equity Allocation
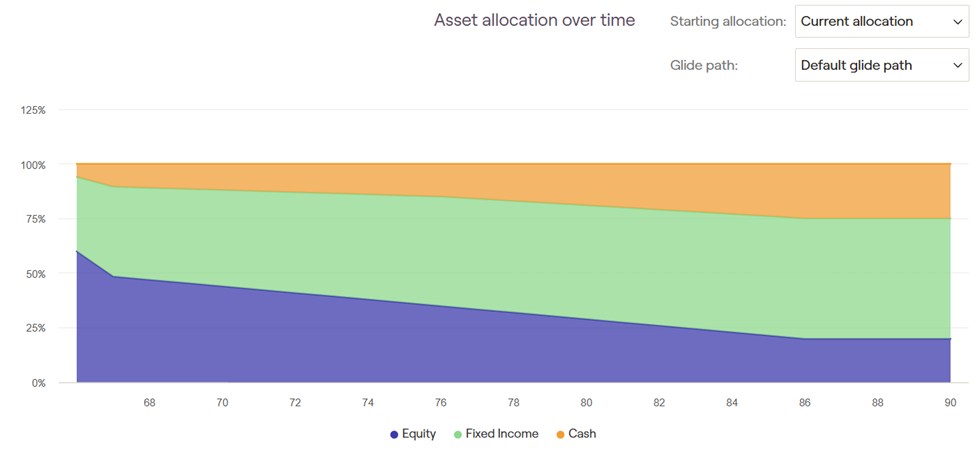
The rising equity glidepath assumes the following asset allocation. The equity allocation is ratcheted down to 40% at retirement and then begins to increase to 50% in the retiree’s mid-70s, 60% in their early 80s, and 80% in stocks in their late 80s.
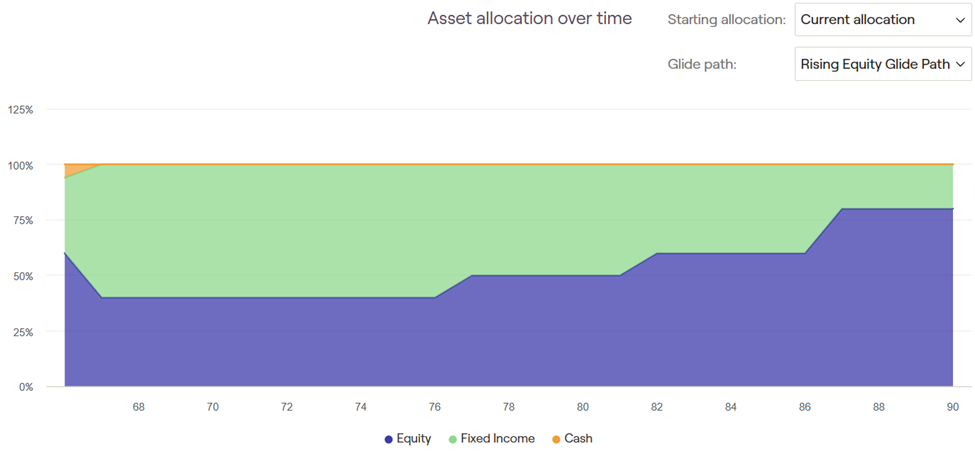
Rising Equity Glidepath
These precise equity allocations are not prescriptive, but the model is meant to evaluate the merits of a rising equity glidepath. The rising equity glidepath reduces risk significantly at retirement and then begins to increase equity allocation after the high-risk years.
What is the Optimal Glidepath?
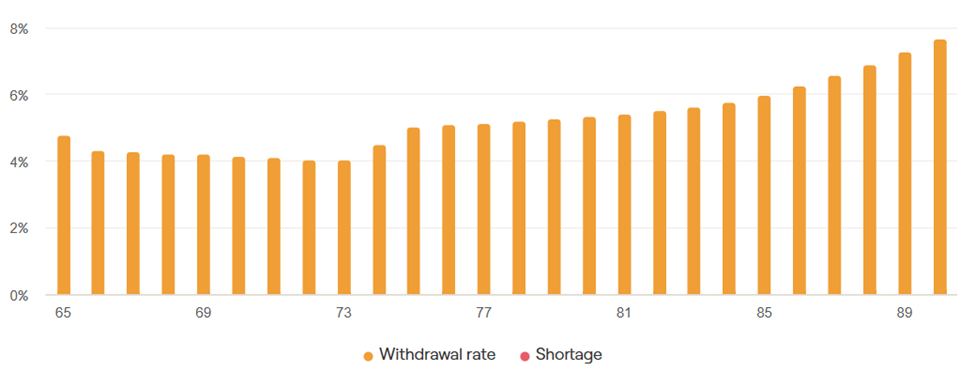
The Monte Carlo results will be compared for these glidepaths for a sample retiree couple. The retiree couple is both age 65, has $1.5 million in investable assets, and intends to withdraw an inflation-adjusted approximately $75k from their portfolio annually, or between 4%-5% per year.
The withdrawal rate of the plan is assumed to look like the following over time. Withdrawals are below 5% until the couple’s mid-70s, at which point withdrawals increase to 5% and steadily increase.
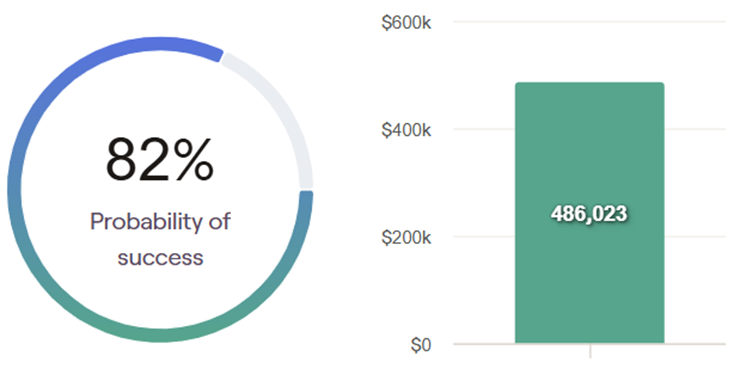
Declining Equity Glidepath: 82% Probability of Success
The declining equity glidepath strategy yields an 82% probability of success and median ending asset value of $486,023 in today’s dollars.
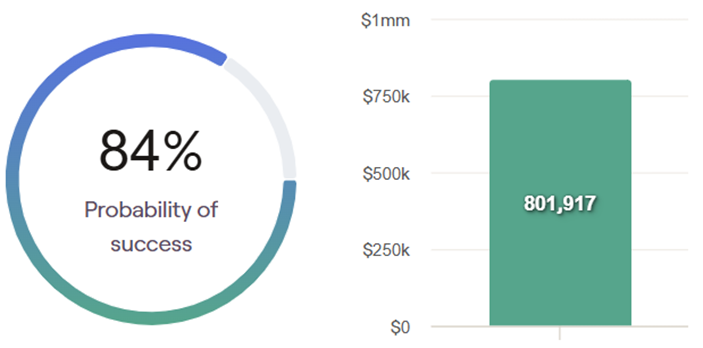
Fixed Equity Allocation: 84% Probability of Success
The fixed equity allocation strategy of 60% stocks yields an 84% probability of success and $801,917 median ending asset value in today’s dollars.
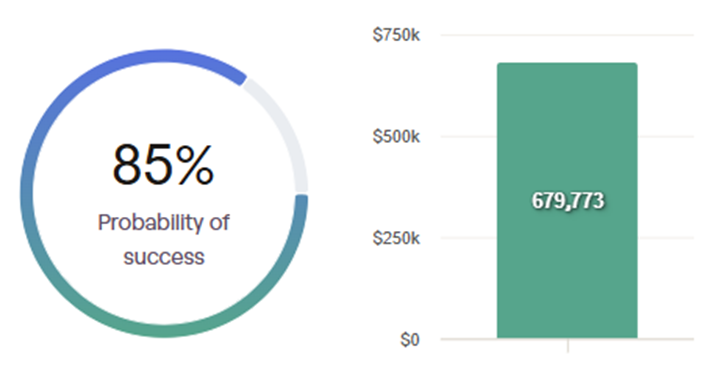
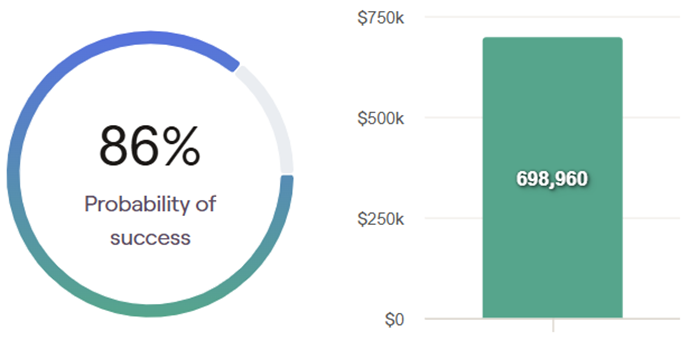
Rising Equity Glidepath: 86% Probability of Success
The rising equity glidepath yields the highest probability of success (86%) and a median ending asset value of $698,960 in today’s dollars.
The rising equity glidepath resulted in the highest probability of success when compared to the fixed equity allocation and declining equity glidepath. The median ending asset value of $698k for the rising equity glidepath is lower than the median ending asset value of the fixed equity allocation strategy, but if a retiree’s objective is to reduce the risk of “failure” or having to change course in retirement, then the probability of success is what we focus on.
Planning for High Initial Withdrawals
Although the rising equity glidepath demonstrates value in the previous scenario where withdrawals were assumed to be relatively similar each year, the strategy may be even more impactful in scenarios where retirees have much higher withdrawal expectations early in retirement.
For example, a couple may rely more on their investments early in retirement due to a combination of factors. Common factors that lead to higher reliance upon investments include: retiring before Medicare-age and assuming higher medical costs before age 65, delaying social security to take advantage of the 8% annual benefit increase, or planning for a bigger travel budget for the first several years of retirement.
The following withdrawal rate example assumes delaying social security until age 70 and an extra $20,000 travel budget for the first decade of retirement. As you can see, the withdrawal rates are assumed to be in the double-digits until the retirees begin receiving social security, and then the withdrawal rate drops again after their travel assumption declines.
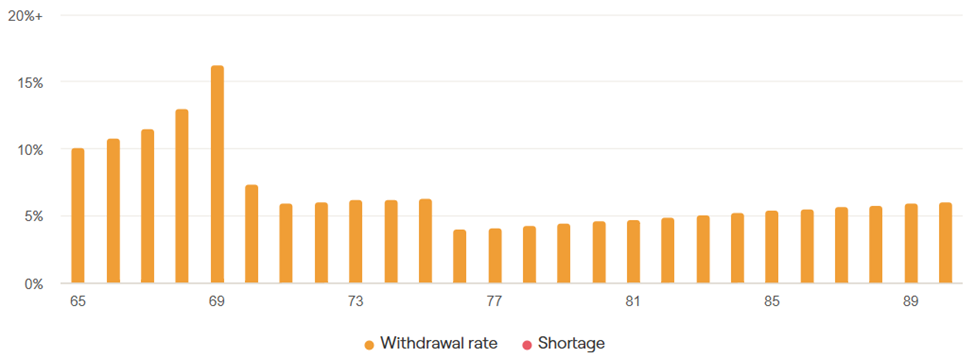
In these scenarios, retirees are even more exposed to the “sequence of returns” risk, or an adverse market environment in the early years of retirement. A significant market decline plus significant withdrawals from the portfolio could permanently impair a portfolio and make it impossible to recover.
Reducing risk through an approach like the rising equity glidepath strategy could be even more valuable in these scenarios, while the declining equity glidepath would subject your portfolio to the greatest market risk exactly when you can’t afford it.
Final Thoughts
While there is a lot I like about target-date funds, the conventional approach to reducing stock exposure throughout retirement is not supported by the data.
A counterintuitive approach to your retirement allocation, like the rising equity glidepath, could meaningfully enhance your retirement plan’s outlook, increasing your ability to spend in retirement and reducing the risk of having to make an abrupt change.