


Planning Your Retirement with Guardrails

The following post summarizes the approach to retirement planning taken by Kardinal Financial. The approach starts with a detailed and highly customized financial model, evaluates the probability of success of the initial plan, and then establishes "guardrails" to identify when a plan may be too conservative or aggressive and proactively identifies changes to our assumptions to combat those scenarios.
Introduction to Retirement Withdrawal Strategies
Retirees have many options when it comes to their retirement withdrawal strategies. Much has been written on the "4% rule", fixed percentage withdrawals, guardrails, and more.
My preferred approach to retirement planning is a "Risk-Based Guardrails" methodology that combines in-depth statistical modeling and predetermined guardrails. The main benefits of this strategy are the ability to customize your financial plan and identify ahead of time both (1) the market event that would warrant a change and (2) the changes you plan to make if we run into those circumstances.
We all desire control when it comes to our finances. Although much is out of our control in markets, this strategy identifies what we can control and proactively plans for a wide range of scenarios.
Retirement Plan Foundation: Monte Carlo Analysis
The retirement plan starts with a Monte Carlo analysis, evaluating a retiree's specific plan assumptions and probability of success.
What is a Monte Carlo Analysis?
Monte Carlo analysis is a statistical tool common in retirement planning to assess the likelihood of achieving retirement goals under a broad range of potential market scenarios. Rather than relying on static projections or a single sequence of returns, it uses thousands of simulations to model how portfolios might perform given the randomness of market returns, changes in savings, withdrawal patterns, and other variables.
For each simulation, the model randomizes factors like investment returns and inflation, then calculates whether a retiree's assets will last throughout their desired retirement horizon. The output is summarized in our financial planning tool with a "Probability of Success" figure and a median ending asset value.
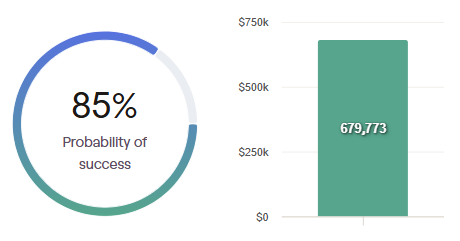
The probability of success is the percentage of the 1,000 simulations in which the retiree did not run out of money by the end of their planning horizon. The median ending asset value is the ending asset value for the middle-of-the-road (or 500th) simulation.
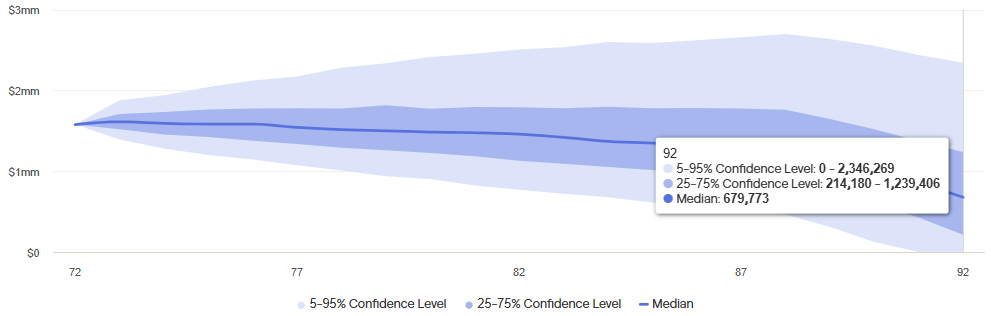
Shown another way, here is the range of outcomes calculated for this retirement plan. Although the median ending asset value is $679,000, there is a wide range of outcomes to the upside and downside.
What's a "Good" Probability of Success?
Many planners suggest embarking on a retirement plan with a probability of success between 75% to 90%. However, there is no "correct" figure and the appropriate probability of success score for you will be dependent upon your risk tolerance and willingness to make changes along your retirement journey.
Although we've been conditioned to shoot for an "A" grade, that is not the baseline target for our probability of success. The probability of success could be thought of more like a pass-fail course than a letter-grade result. A result in the 90s could mean you are living far more conservatively than you need to and you are likely to leave a significant sum to your heirs.
Another way to interpret the probability of success figure is the probability of having to make an adjustment. For example, a probability of success of 90% could be interpreted as a 10% probability of needing to make an adjustment to your plan.
So the more comfortable you are with making a spending adjustment in the future, the lower your initial probability of success figure could be.
If you want greater certainty that you can live your retirement plan precisely as initially assumed, then a result of 90% or greater may be appropriate. But if you want to spend or give more aggressively and are flexible in making adjustments, a probability of success of 75% or even lower may be appropriate.
Importantly, we are evaluating your retirement plan on an ongoing basis. A retirement plan doesn't go straight from 75% to 0%. As you can see in the range of outcomes graph above, we would know when things aren't going according to plan and be able to correct course, rather than blindly following the initial roadmap.
As we will discuss later, we will set lower guardrails in terms of the probability of success and identify adjustments you can make if your plan drops from 75% to 60% or some other predetermined lower bound.
Strengths of Monte Carlo Retirement Planning
The main strengths of using a Monte Carlo tool for retirement planning is the customizability of the assumptions and the range of scenarios tested.
The Monte Carlo simulation accounts for highly customized scenarios. Although many people are familiar with the "4% rule," which suggests a retiree may safely withdraw an inflation-adjusted 4% from their portfolios, the idea of spending a similar amount for every year of retirement is unrealistic.
Monte Carlo tools allow you to evaluate the impact of:
- Retiring before Medicare eligibility and accounting for higher medical costs before age 65
- Delaying social security and requiring greater portfolio withdrawals in the early years of retirement
- Planning for greater travel in the first decade of retirement before slowing down in your later years
- Downsizing to realize your home equity and right-size your living arrangement
- Potential long-term care costs in your final years
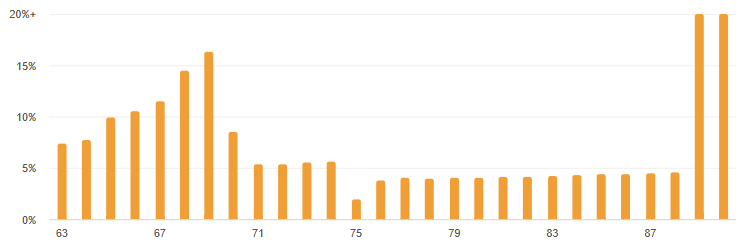
For example, below is the assumed withdrawal rate for a retirement plan with a 79% probability of success. The plan includes a significant travel budget from age 65 through age 70, delaying social security until age 70, downsizing at age 75, and long-term care costs for the final two years of the retirement horizon. Withdrawals are significantly above the "4% rule" to start retirement, but fall dramatically as travel lessens, social security kicks in, and the couple downsizes to free up equity in their home.
Weaknesses of Monte Carlo Retirement Planning
Monte Carlo simulations are not without their drawbacks. The risks or weaknesses of Monte Carlo analyses include:
- A reliance on the assumptions embedded within the plan - Modest changes to return or inflation assumptions can result in vastly different results.
- Probability of success framing - Education and potential reframing of the Probability of Success metric is required to avoid retirees shooting for an overly conservative plan.
- Overconfidence in Plan Results - Even in a 90% initial scenario, negative market events can require a retiree to make a change. Although the Monte Carlo simulation runs through 1,000 scenarios, the future is always uncertain.
Establishing Guardrails for a Retirement Plan
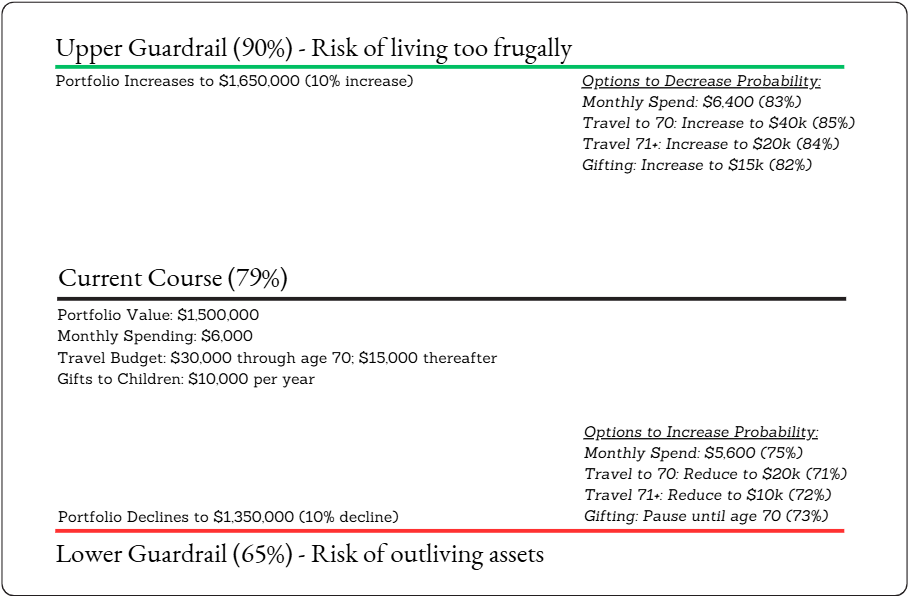
Once we have established a retirement plan baseline, we then set guardrails for your plan that would warrant a change. The below example starts with a probability of success of 79% and highlights the investment portfolio changes that would increase the result to 90% or decrease the result to 65%.
We set an upper guardrail for scenarios where your probability success increases dramatically and would allow for additional spending. The "risk" in these scenarios is you may not live as fully as possible given your new circumstances. We explore ways to increase spending or giving to reduce your probability of success back to the middle range.
The lower guardrail identifies scenarios where your probability of success drops to an unacceptably risky level and is more likely to require a change in your lifestyle or goals.
Using our retirement planning software, we may adjust your investment account balances and hold all else equal to understand the portfolio values that would trigger these scenarios.
Identifying Adjustments to Your Plan
After identifying the portfolio values that would breach your upper and lower guardrails, we then go through an exercise of identifying what changes you could make to move your probability of success back in the right direction. This exercise is particularly important for the lower guardrail as the risk of running out of money is obviously more significant than accumulating too much.
For example, the retirement plan summarized below starts with a probability of success of 79%, but an immediate portfolio change of 10% in either direction would change the probability of success to 65% (the lower guardrail) or 90% (the upper guardrail).

Virtually infinite possibilities are available to move the probability of success back towards 79% and several examples are listed for each guardrail.
In the case of a portfolio decline of 10% that would reduce the probability of success to 65%, adjustments and corresponding changes to the probability of success include:
- A reduction in monthly spending from $6,000 to $5,600 increases plan outlook to 75%
- Reducing travel spending through age 70 from $30k per year to $20k per year increases the plan outlook to 71%
- Reducing travel after age 70 from $15k per year to $10k per year increases the plan outlook to 72%
- Pausing the $10k annual gifts to children until age 70 increases the plan outlook to 73%
Any combination of these adjustments and others could move the plan to a higher probability of success.
Monitor and Update
This exercise is helpful in putting hard numbers to the changes in your investment portfolio that would warrant an adjustment and then specifying the changes you can make to influence your plan. Market corrections are especially frightening as you begin drawing from your portfolio, and we all desire control in these out-of-control market environments. You can proactively identify changes to your plan for these uncertain moments to provide more peace of mind in your plan.
Your probability of success will change from year to year as we update your retirement plan, investment returns are realized, and we update our assumptions around spending, returns, and inflation. But during each update, we go through the exercise of identifying your guardrails and the changes in your control to influence your plan.
Ultimately, this process is intended to give you peace of mind in your retirement plan and reduce the risks of both living too frugally or outliving your savings.