


Estimating Future Returns

Financial plans are very sensitive to your assumed returns. Although no one knows what the future will bring, it's important to have reasonable assumptions embedded within your plan, rather than relying on historical returns or backtests.
In this post, I'll walk through the process I use to develop forward-looking return assumptions for financial planning and Monte Carlo simulations.
Historical vs. Forward-Looking Returns
If you’ve listened to enough financial podcasts or read enough investment blogs, you’ve likely heard “Past performance is not indicative of future returns.” If past performance could predict future returns, financial planning would become much simpler!
While historical data is informative, what matters for financial planning over the next 30+ years are reasonable forward-looking expectations.
The following sections detail how I estimate forward-looking returns and risk, which is then input into financial planning software and Monte Carlo simulations.
Portfolio Estimate Tool: Testfol.io’s Portfolio Optimizer
Testfol.io's Portfolio Optimizer is an excellent tool for generating investment portfolio return and risk assumptions, which may be input into your financial planning tool. The site pulls historical return, volatility, and correlation data for a set of tickers, which you may then override with your own forward-looking assumptions.
Below is the process to generate your own portfolio assumptions:
- Navigate to the Portfolio Optimizer and enter your desired tickers or asset classes
- Check the "Use Historical Values" box to populate historical return, volatility, and correlation data as a starting point.
- Set your assumed cash rate and Max Leverage (set max leverage to 1 in order to avoid the “optimizer” suggesting a levered portfolio)
- Overwrite the historical return, risk, and correlation figures with your own forward-looking assumptions
- Check the "Exposure Limits" box and set the min/max for each asset to your desired portfolio weight to see that specific portfolio's expected outcome.
Note: the tool needs at least one asset to "float" (not be locked to a single number), or it will generate an error. To avoid this error, lock every asset’s weights except one; the result will be your target portfolio.
Below is a screenshot of what these inputs could look like. The blue-shaded data includes historical data which may be overwritten with your own expectations or assumptions, which will be discussed in the subsequent sections.
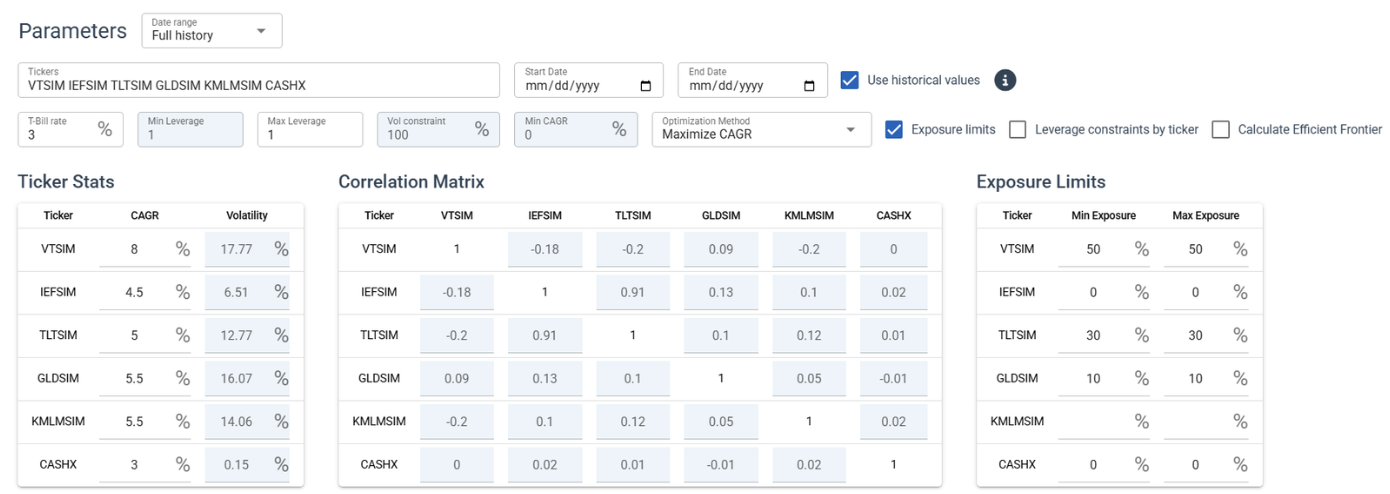
Note that the “Exposure Limits” lock all of the assets with specific figures except for one asset class. The result will be a 50% VTSIM, 30% TLTSIM, 10% GLDSIM, and 10% KMLMSIM portfolio.
Asset Class Estimates: Cash + Risk Premium
My preferred approach for estimating long-run asset class returns for financial planning is a “Cash plus Risk Premium” methodology.
The key tenet of this approach is that any investor can earn the cash, or “risk-free,” rate through a high-yield savings account or investing in short-term Treasury bills. Therefore, investment in any risky asset class demands a “risk premium” above the cash or risk-free rate.
So you start with the current risk-free rate and apply a “risk premium” to each asset class based on very long-run historical data and reasonable forward-looking estimates.
Below is an example of several asset classes and potential risk premiums.

Essentially, with one input of the current risk-free rate, you can then apply risk premiums to investment assets to derive reasonable forward-looking return assumptions.
The following details how these risk premiums were derived.
Stocks: 5% Risk Premium
The UBS/London Business School Global Investment Returns Yearbook (Dimson, Marsh, and Staunton), the standard reference for century-plus asset returns across 35 markets since 1900, finds a 125-year annualized real return of roughly 5.2% for world equities versus 0.5% for cash. This equates to a risk premium of 4.7%.
The US-specific Ibbotson SBBI dataset shows a somewhat higher long-run premium, closer to 6.5%, reflecting the US market's historical outperformance.
The 5.0% estimated risk premium for stocks errs toward the long-run global stock market risk premium, rather than assuming the outperformance of U.S. stocks will persist over the next 30+ years.
Bonds: 1.5%-2.0% Risk Premium
“Term” premiums for Treasury bonds are assumed to be 1.5% for intermediate-duration Treasury bonds and 2.0% for long-duration Treasury bonds.
The SBBI dataset from 1926-2018 shows intermediate US government bonds returning 1.7% annualized above Treasury bills and Long-Term government bonds returning 2.2% annualized above Treasury bills.
These cash plus risk premium figures closely align with current yields, which are by themselves an excellent proxy for forward-looking return estimates. As of August 2026, the 10-year Treasury yield is 4.65% and the 20-year Treasury yield is 5.19%.
Gold: 2.5% Risk Premium
Gold or managed futures are likely to be the most contentious of forward-looking estimates.
Some long-run academic research is skeptical of any risk premium for gold, citing a long-term history of preservation of purchasing power, but nothing more.
On the flip side, some argue much of this history is distorted by the U.S. being on a gold standard until 1971. Prior to 1971, gold was pegged at $35/oz for decades. A reasonable argument may be made that gold’s role in an investment portfolio has changed after the collapse of the Bretton Woods system.
JP Morgan’s 2026 Long-term Capital Markets assumptions estimate a 5.5% annualized return for gold over the next 10 years.
A 2.5% risk premium estimate clearly leans towards an assumption of a “new” role for gold compared to its very long history, but this assumption may be stress-tested when evaluating the total portfolio expectations (to be discussed later).
Managed Futures: 2.5% Risk Premium
This will be another contentious estimate due to limited live fund history and a particularly poor period during the 2010s.
Unlike stocks, bonds, and even gold — where institutions publish explicit forward-looking numbers you can cite or dispute — managed futures doesn't have an established forward-looking consensus estimate.
AQR's "A Century of Evidence on Trend-Following Investing" documents a persistent premium across roughly a century of data and multiple asset classes, with a Net of 2/20 Fee, Net of Cost Excess Return of 7.3% from 1880-2016.
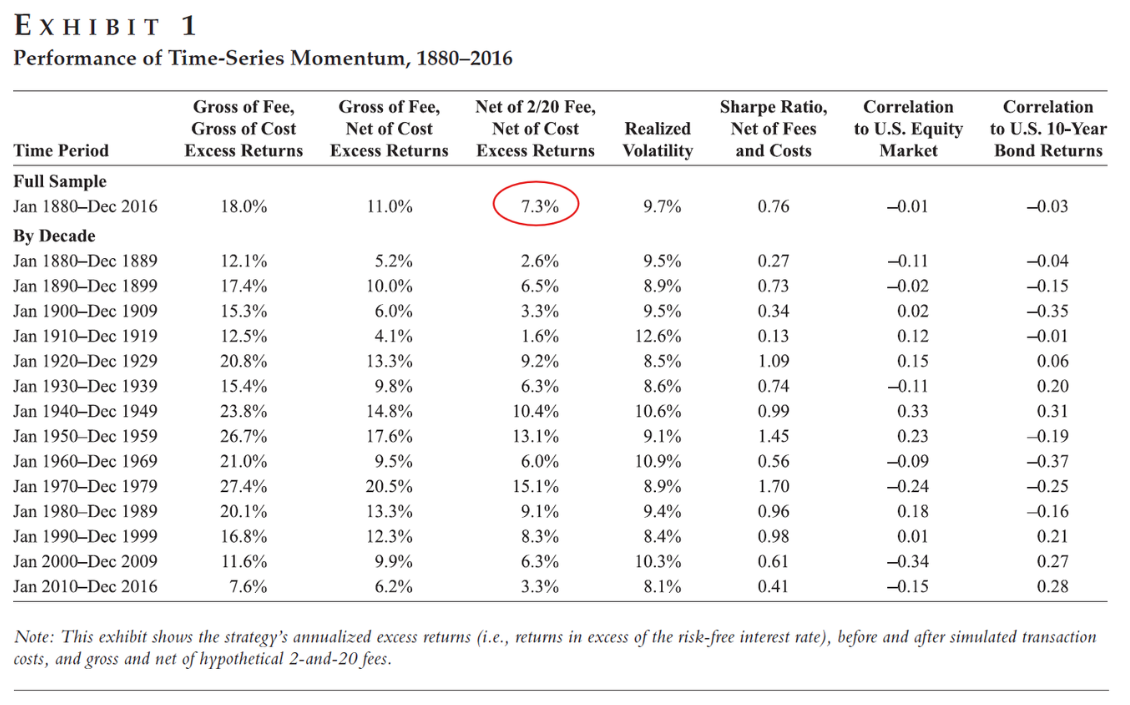
Source: AQR: A Century of Evidence on Trend-Following Investing
Forward-Looking Returns vs. History
For perspective, here is how these cash plus risk premium estimates compare to actual returns for these strategies from 1988 through July 2026. In every case, the forward-looking return estimates and risk premiums are more conservative than the 1988-7/2026 period.

Data source: Tesfol.io. Stocks are proxied by VTSIM, the Vanguard Total World Stock Index ETF (VT) with Global Equity market performance and no expense ratio included before VT’s inception. Intermediate Treasuries are proxied by IEFSIM, the iShares 7-10 Year Treasury Bond ETF (IEF) with simulated intermediate Treasury performance and a 0.15% expense ratio included before IEF’s inception. Long Treasuries are proxied by TLTSIM, the iShares 20+ Year Treasury Bond ETF (TLT) with Long-term Treasury Bond performance and a 0.15% expense ratio included before TLT’s inception. Gold is proxied by GLDSIM, the SPDR Gold Minishares ETF (GLD) with simulated gold performance and no expense ratio before GLD’s inception. Managed Futures are proxied by KMLMSIM, the Kraneshares Mount Lucas Managed Futures ETF (KMLM) with Mount Lucas Managed Futures data and 0.9% expense ratio included before KMLM’s inception.
Creating Forward-Looking Portfolio Expectations
With these asset class assumptions, we may now use the Testfol.io tool to generate total portfolio return and risk expectations.
Rather than relying on the historical return data to inform our financial planning and retirement projections, we can use our cash plus risk premium assumptions.
For example, we can overwrite the historical return (CAGR) data with our 3% cash plus risk premium assumptions. We can estimate a sample risk parity portfolio (50% stocks, 30% Long Treasuries, 10% gold, 10% managed futures) risk and return by entering these weights in the Exposure Limits section.
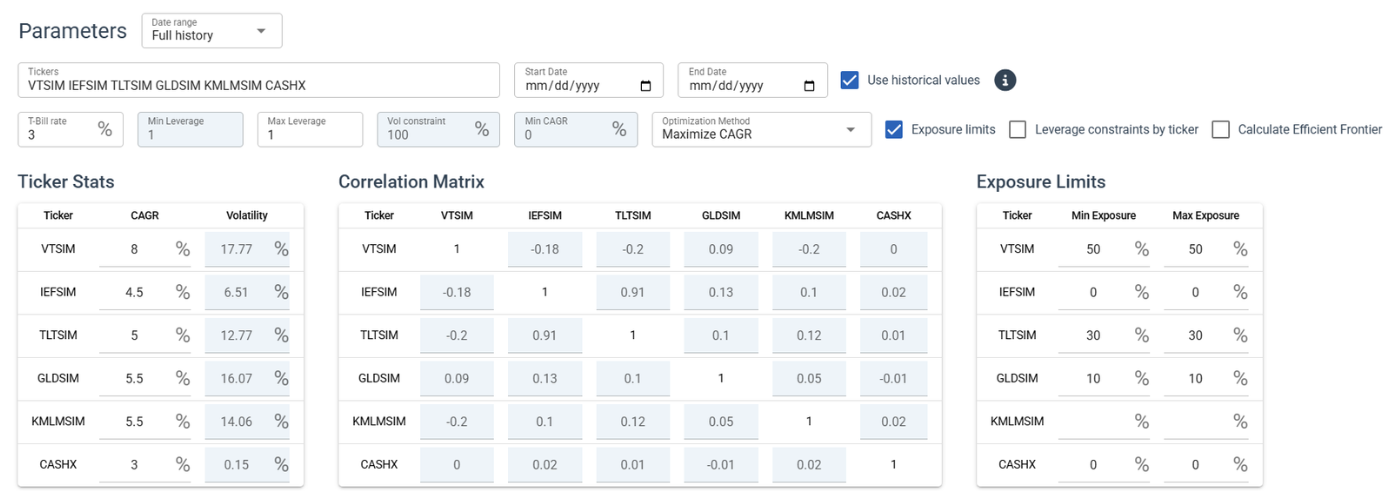
By clicking "Optimize", the tool then provides expected return and risk for the total portfolio given these assumptions. These expected portfolio values may then be used to inform your financial planning and Monte Carlo calculations.
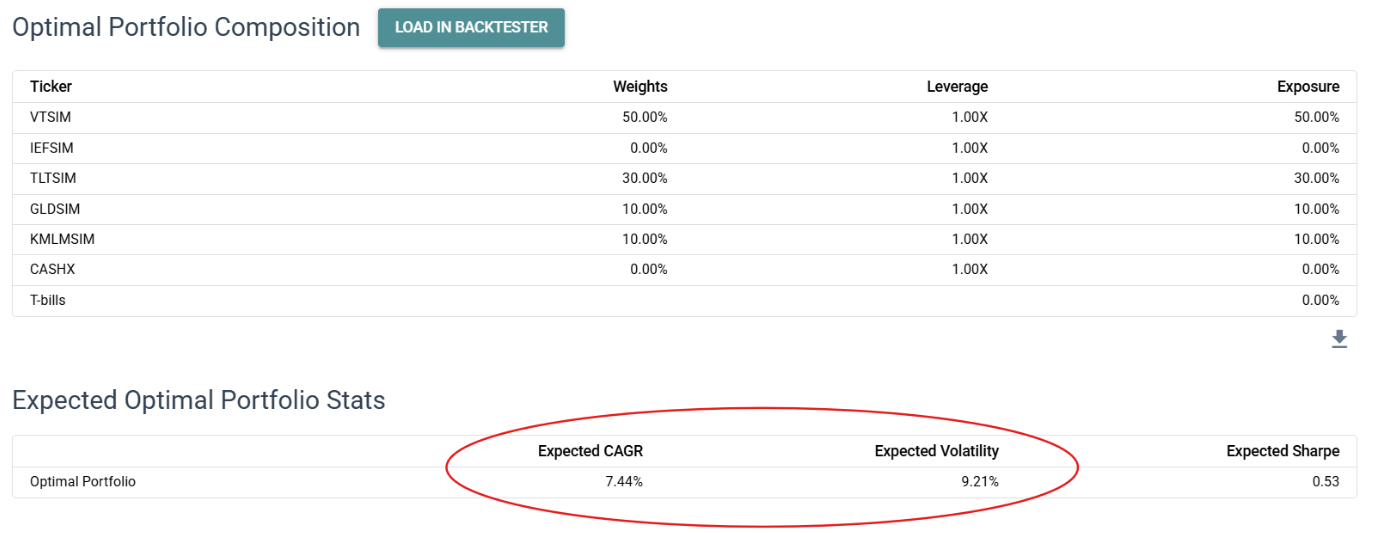
From here, you can adjust the assumptions to stress test your assumptions and see the impact on the expected return and risk of the portfolio.
For example, what if the gold risk premium is 0% instead of 2.5%? Then your expected return drops to 7.19% annualized with the same 9.21% volatility. This is a decline of 0.25% per year expected return compared to the 2.5% gold risk premium.
What if the historically negative stock and bond correlation is zero? Then your expected return is 7.37% annualized with higher annualized volatility of 9.92%. This shows a slight reduction in expected return, but more significant increase in expected volatility as the historical correlation benefits are reduced.
Final Thoughts
Although specific examples and figures were featured in this post, these specific figures are less important than the process behind them.
Although it may be tempting to rely upon historical data, volatilities, and correlations, there is significant risk in relying on backtests and “overfitting” the data. While backtests are interesting and informative, what really matters is what will happen next.
By following this process, you may generate reasonable forward-looking return estimates to inform your financial planning and also compare different portfolios without relying on hindsight.